|
TERMS OF USE:
This free image can only be used for non-commercial, personal
website use only. THIS IMAGE CANNOT BE
used in galleries, downloaded to your computer, posted on sites for
others to use, manipulated, downsized, or upsized. If you are confused about the
terms of use or have any questions then contact us before using the image.
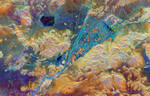
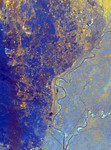
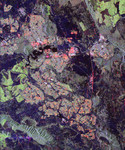
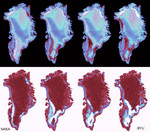
Free Picture: Sea Winds, Greenland
|
Description
Image of sea winds in Greenland. The frequent coverage provided by NASA's SeaWinds instrument on the Quikscat satellite provides unprecedented capability to monitor daily and seasonal changes in the key melt zones of Greenland, which is covered with a thick ice sheet that resulted from snow accumulating over tens of thousands of years. The thickness of the snow layers reveals details about the past global climate, and comparing snow accumulation and snow melting can provide insight into climate change and global warming. In particular, the extent of summer melting of snow in Greenland is considered a sensitive indicator of global change. Earlier scatterometer data has suggested that Greenland has experienced significantly more melting in recent years. This figure compares the melting observed over 15 days during July 1999 in Greenland. The red areas around the central blue and white areas are the main melt zones and have lower radar back scatter because of water on the surface that saturates the surface snow. As the days warm up, the melt extent dramatically increases. Comparing this data with computer models and past scatterometer data will help scientists evaluate the inter-annual variability of the melting as a step toward understanding potential climate change. The world's large ice sheets in Greenland and Antarctica act as vast storehouses of freshwater. Summer season melting releases large quantities of freshwater into the ocean, and year-to-year variations can have a significant impact on global sea level. Furthermore, long-term changes in the patterns and extent of melting on the large ice sheets reflect the effects of climate variability; thus Greenland is considered a sensitive indicator of global warming. Satellite microwave radars are extremely sensitive to melting and can provide the only effective means of accurately measuring the year-round picture of the extent and variability in ice sheet melting. Daily mean images were produced from QuikScat data c
Keywords
earth science, geography, global warming, greenland, jpl, sea winds, seawinds, nasa, free photography, free photo, free photos, free picture, free pictures, free image, free images
|
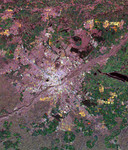
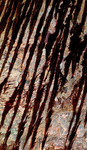
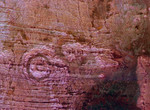
Similar Free geography Pictures
|
|
|
|