
|
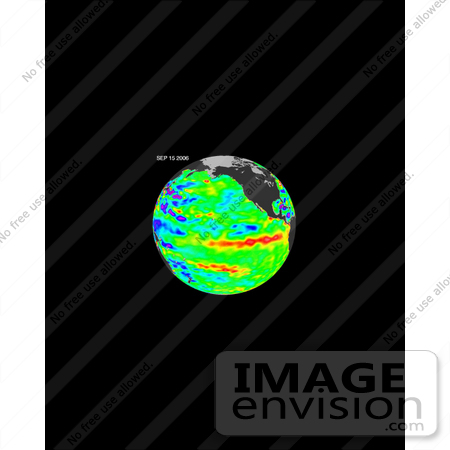
In September 2006, NASA satellite data indicated that El Nino had returned to the tropical Pacific Ocean, although it was relatively weak. As of early October, scientists were not sure if the event would persist, and it was much less intense than the last major El Nino episode, which happened in 1997-1998. That event brought devastating floods to California that cost millions of dollars in damage while severe drought struck Indonesia, Australia, and the Philippines. Among the ocean characteristics that signal developing El Nino events is a change in average sea surface height compared to normal sea level. When water warms, it expands a little, which changes its volume slightly. When heat begins to build up in the Pacific during an El Nino event, the sea surface height begins to creep up. NASA observes changes in average sea surface height using its Jason satellite. The image is based on the average of 10 days of data centered on September 15, 2006, compared to the long-term average of observations from 1993-2005. In this image, places where the Pacific sea surface height is higher (warmer) than normal are yellow, orange, and red, and places where the sea surface is lower (cooler) than normal are blue and purple. Green shows where conditions are near normal. The swath of red in the center of the scene reveals that an El Nino was in progress when Jason observed the Pacific. El Nino is a cyclical warming of the ocean waters in the central and eastern tropical Pacific that generally occurs every 3 to 7 years. It is linked with changes in air pressure and high-level winds that can affect weather worldwide. Typically peaking during the Northern Hemisphere winter months, El Nino is the warm phase of the El Nino/Southern Oscillation. Photo Credit: NASA/JPL Ocean Surface Topography Team [0003-0612-3114-4111] by 0003
|
Keywords
earth, earth science, el nino, environment, environmental, global warming, jason 1, jason1, jason1 altimetric satellite, jpl, nasa, science
|
|


